ArcticRIMS Site Tour
Frequently Asked Questions
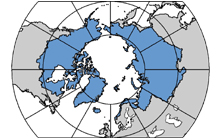
How can I create a map of Arctic-RIMS gridded data?
The creation of a map from an Arctic-RIMS gridded data set
can be achieved via the Arctic-RIMS Data Explorer interface. Access
to the Arctic-RIMS Data Explorer interface can be found under the
"Data" button link off of the main Arctic-RIMS web page.
Users must first choose a variable data set from the Data
Explorer Variable Picker and then choose a temporal and spatial
scale with the Data Explorer Data Cube (See: Tour/Data Cube and
Variable Picker). In making a selection within the Data Cube, the
Map Display Window in the Data Explorer interface should then redraw
to include a map that accommodates the user's selections.
Alterations to a user created map within the Map Display
Window can sometimes be made. Users can add Operations and
Re-Analysis site river discharge points on the map by clicking on
the "Show Operational Sites" or the "Show Re-Analysis Sites check
boxes. Some data sets also accommodate other map display options.
The static Elevation data set can be displayed as Mean, Minimum,
For Maximum elevation by choosing one of the map draw radio buttons
that appear directly above the Map Display Window when this data set
is loaded. Other draw options for other data sets might also be
available via map draw radio buttons above the Map Display Window.
|