ArcticRIMS Site Tour
System Components and Functionality
Data Browser
Once a user chooses their variable and spatial and temporal resolutions within the
variable picker and data cube, they can then browse their choosen data visully or
numerically within the data browser section of the Arctic RIMS data explorer tool.
The data browser consists of three major components, the map display, the
numerical data display and the animation tool. All components work in conjunction
with each other, but have specific functionalities within themselves.
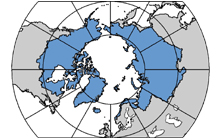
The map display exhibits user choices as chosen within the variable picker and
the data cube. Zoomed displays per continent, sea basin or watershed can be created
and displayed by the user by choosing specific continents, sea basins or watersheds
from the pull down spatial navigation selection boxes found directly below the
variable picker. Upon choosing a selection from any of these selection boxes the
display will redraw and display the user defined variable, temporal and spatial
resolutions. Spatial resolution zooms can also be completed by simply clicking on
the continent, sea basin or watershed of choice in the map display window. Once
zoomed to an extent, a user can zoom back to the full Pan-Arctic extent by clicking
anywhere in the ocean within the map display. Users can also pan to an adjacent
watershed, sea basin or continent by simply clicking on it. The display will then
be redrawn to your new extent. All data sets exhibited within the map display window
have a corresponding legend of associated data values below the map display window.
Mean, Minimum or Maximum data values can be exhibited within the map display for
any static data sets by simply choosing one of the radio button choices above
map display window. Map values, Anomaly values or a histogram of data values can be
displayed within the map display window for any non-static data sets by choosing the
radio buttons that appear above the window.
Operational and Re-Analysis sites can be drawn on top of any data display by choosing
the "Show Operational Sites" and "Show Re-Analysis Sites" check boxes above map
display. Users can then view the names of each site by simply passing their mouse
over the sites. The names of each site are then displayed within the text box to
the right of the "Show..." check box choices. More in-depth stream discharge station
information can be obtained by clicking on any Operational or Re-Analysis sites on
the map. This information is displayed on a separate pop-up page that has a set of
unique controls. The use and functionality of these pages and their controls are
discussed below.
Once a user's data variable and resolutions are displayed properly within the map
display window the user may query latitude, longitude, basin and sea basin values
from within the displayed map by passing the mouse cursor over any pixel on the map.
The latitude, longitude, basin and sea basin values associated with each pixel are
displayed within the numerical data display in the Mouse Over box found to the right
of the display window as the mouse cursor is passed over a location in the map display.
Data values for the user chosen variable and resolutions may also be displayed within
the numerical data display. In order to view these values the user must first load
the data set by clicking on the check box next to the variable within the data
numerical data display within the Mouse Over box. Data can be viewed for any single
pixel without having to load an entire data set by clicking on the pixel. The data
values associated with the pixel can then be viewed within the "Data for Selected
Grid Cell" box.
Users can animate chosen temporal data sets within the map display by setting a from
and a to date within the Animation window found to the lower right of the map display
window. Animations are activated by clicking on the Start Animation button within
this window once the dates are set. Users are also given the option to view a full
time series graph of the animation date range as specified in the from and to date
boxes. A single image may also be displayed for any single date in a similar fashion
within the Animation window. Note that data frame dates are displayed in the upper
right hand corner of the map display window when using the animation tool.
|